
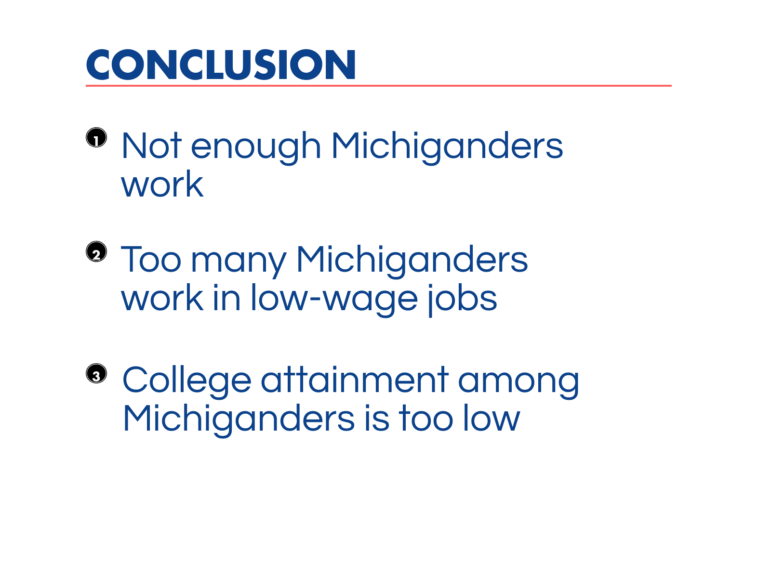
When broad economic prosperity is your goal–when you want to see all households growing in income and financial stability–what you measure really matters. Michigan Future has put together a very clear set of up-to-date data that paint the picture of Michigan families’ economic well-being. It’s not pretty. In our first post on this data, I went over four important measures–where Michigan is in the bottom half, and in some cases, the bottom third in the nation. You can click here to review that post, and here’s a summary:
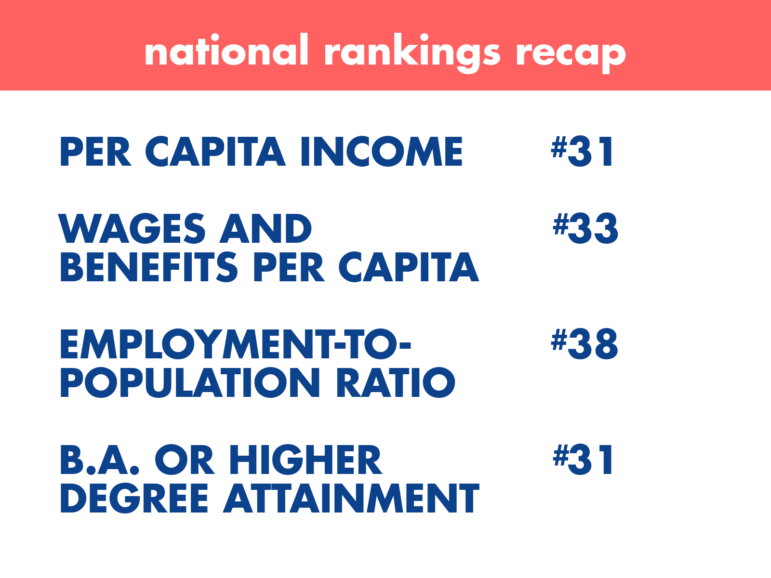
Too many people are out of work, too many people are in low-wage jobs, and too few people have the college degree they need to qualify them for higher wage work. Today, we’re going to get into the relationship between education and work. The next graphic is based on data from employers on jobs in Michigan.
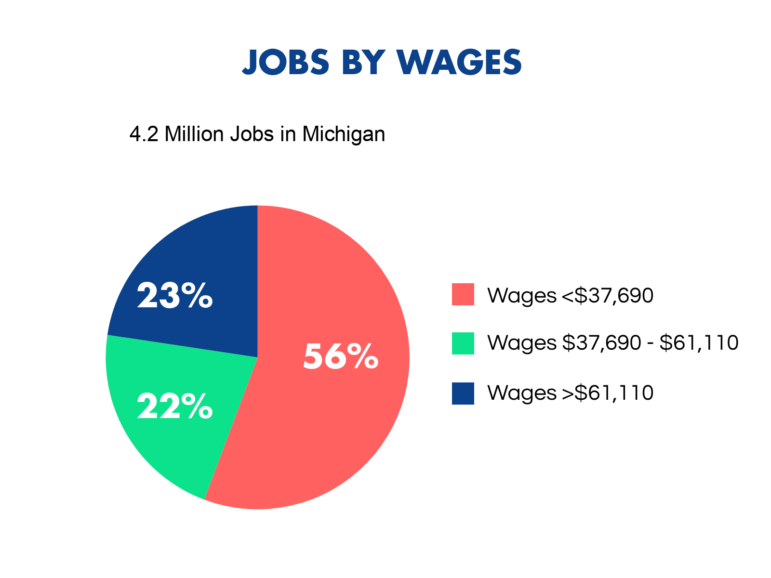
Of the 4.2 million jobs in Michigan, 56 percent of the jobs in Michigan are in occupations with median wages less than the national median ($37,690). Only 22 percent are in occupations with median wages between the 50th and 75th percentile for the nation. Only 23 percent of the jobs in Michigan are in occupations with median wages more than $61,110. We find that many people are really surprised that such a large percentage of jobs in Michigan are low-paying.
Now, let’s look at the educational requirements for those jobs.
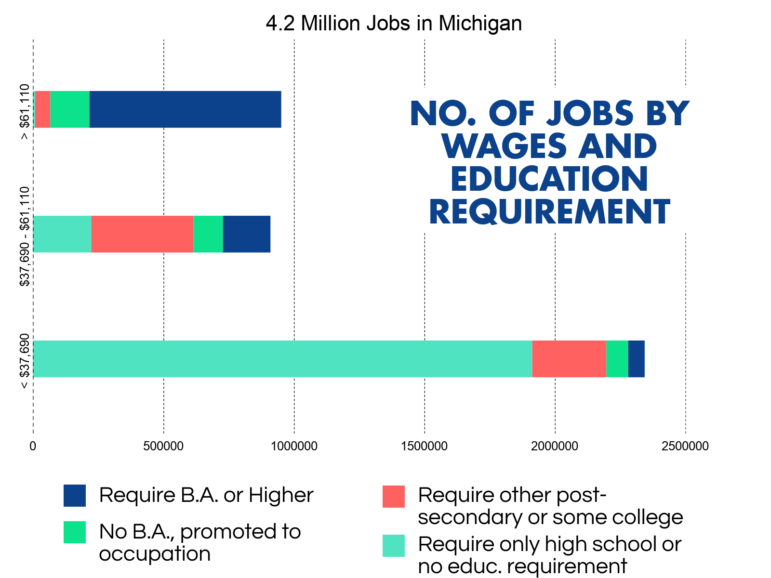
This chart is a smidge more complicated, but stay with me. Each bar represents the number of jobs available in Michigan at each of the wage ranges we used earlier (based on the median wages of those jobs). The colored segments within the bar show the proportion of jobs in that range that require different levels of education. For example, jobs in navy blue require a bachelor’s degree or more; jobs in orange require some post-secondary education less than a BA. Skilled trades certificate holders and those with some college or an associate’s degree are qualified for these jobs.
It probably doesn’t surprise anyone that more of the high-paying jobs require more education. But what people do tend to find surprising in this chart is the relative smallness of the number of good-paying jobs that don’t require a BA. Only 8 percent of jobs that require some post-secondary education but not a B.A. will earn an employee $61,110 or more (this doesn’t include jobs that are based on being promoted). The total number of jobs that pay at least the national median ($37,690) or more and require some college but not a BA (and aren’t based on experience) represents 11 percent of total jobs in the state.
And for people who use anecdotal evidence to claim that a BA isn’t a guarantee of a good-paying job–well, nothing is a guarantee–but it’s as close as you can come. 75 percent of jobs that require a BA (75 percent of the jobs in blue, above) pay in the highest range.
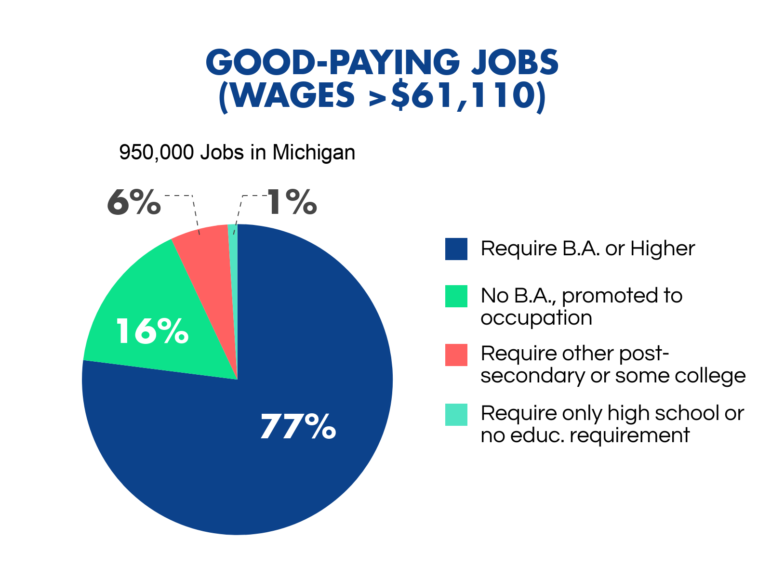
And now, looking more closely at just that segment that represents those higher-wage jobs–23 percent of jobs in the state–it’s easy to see why the number of Michigan residents with a college degree is so important to our economic well-being. The large majority of jobs that pay $61,110 or more require a BA–or more. (For more on the BA premium, check out Lou’s post from last week.)
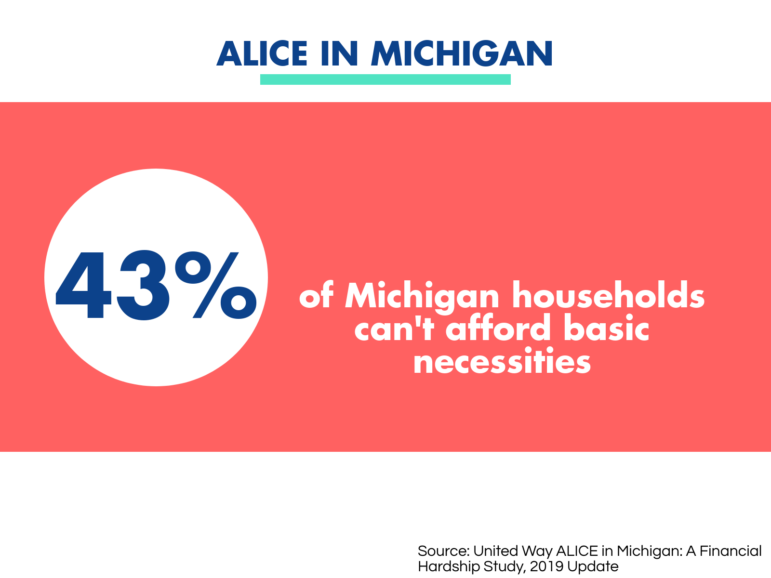
Taken all together, these figures make it pretty clear why so many Michigan households are struggling. The United Way just released a 2019 update (with 2017 data) to its ALICE report, which measures financial hardship, particularly among working people. In its last report, United Way showed that 40 percent of Michigan households can’t afford basic necessities. This year, it’s up to 43 percent.
It’s interesting to check out the list of ALICE rates by county, which will dissolve any notions that it’s a problem, “over there, but not in my community.” That list is on page 5 of the new report (p.12 of the PDF). No county in Michigan has an ALICE rate lower than 30 percent. Some counties are topping 60 percent.
When you measure the right things, the conclusion is clear: Michigan families are struggling, it’s structural to the economy, and it’s getting worse. The solutions, unfortunately, aren’t dead obvious. So let’s start by understanding the gravity and dimensions of the problem.
You can download the entire set of graphics as a slide deck here.
Occupational data in this post from the Bureau of Labor Statistics, Occupational Employment Statistics, 2017, compiled and analyzed by Don Grimes for Michigan Future.