From 2001-2010, the seven county Grand Rapids regional economy performed better than the Michigan economy. That said it was a decade of decline. And the region in 2010 was one of the poorest of all the metropolitan areas in the country with a population of one million or more.
Employment and Wages
In 2010 there were 534,000 jobs in metro Grand Rapids, a decline of 62,000 (-10.4%) from 2001. Just like the nation, underneath the poor jobs record of the decade is the continuing divergence between the high and the low education attainment sectors. Metro Grand Rapids employment in the high education attainment was 190,000 in 2010, an increase of 6,000 jobs (3.1%) from 2001. In health care and education––where the national high education attainment job growth was concentrated––job growth in metro Grand Rapids was around 11,000, an increase of 12.8% between 2001 and 2010. In the low education attainment sectors employment was 343,000 in 2010, a decline of 68,000 jobs (-16.5%) from 2001.
The average wage in metro Grand Rapids followed the same pattern as the nation: high education attainment industries growing and low education attainment industries declining. The average wage for all jobs in the Grand Rapids region in 2010 was $39,823, a decline of 0.8% from 2001. In the high education attainment sectors the average wage was $49,160 a gain of 4.7%. In the low education attainment sectors the average wage was $34,647, a decline of 6.6% from 2001.
The gap in the average wage between the high and low education attainment sectors grew from $9,841 in 2001 to $14,513. In 2010 the average worker in the high education attainment sectors had wages a little more than 1.4 times that of the average worker in the low education attainment sectors. The average wage differential between the high and low education attainment sectors is much smaller in metro Grand Rapids than the country. Metro Grand Rapid’s average wage in 2010 was just about at the national average in the low education attainment industries. By comparison in the high education attainment industries, metro Grand Rapid’s average wage in 2010 was 20.8 percent below the national average.
Personal Income
Per capita income in metro Grand Rapids in 2010 was $33,441, a loss of $1,337 (-3.9%). The underlying sources of region’s personal income is worrisome, with a large decline of real private sector employment earnings per capita from 2001 – 2010 masked by even larger income gains from government––either government employment earnings or, most importantly, transfer payments.
- Private sector employment earnings per capita in 2010 was $20,937 a loss of $3,399 (-14.0 %) from 2001
- Government employment earnings per capita in 2010 was $2.897 a gain of $74 (2.6 %) from 2001.
- Personal income per capita from interest, dividends and rent was $5,166, a loss of $612 (-11.4%) from 2001.
- Transfer payments per capita in 2010 were $6,762, a gain of $2,392 from 2001 (54.7%).
The dramatic growth in transfer payments was accompanied by a sharp increase in the share of the population who were poor or nearly poor. In 1999, 15.3% of the metro Grand Rapids population had an income that was less than 1.5 times the poverty level. By 2010, this value had increased to 25.2%. Metro Grand Rapids has become increasingly poor and more dependent upon transfer income, not a good start to the 21st Century.
How metro Grand Rapids in 2010 compared to the country (Note: the rankings are out of 54 metros with a population of one million or more)
- Proportion of wages from high education attainment industries: 53rd/75.4% of US
- Average wage: 49th/85.2% of US
- Average wage in high education attainment industries: 50th/79.2% of US
- Average wage in low education attainment industries: 27th/99.8% of US
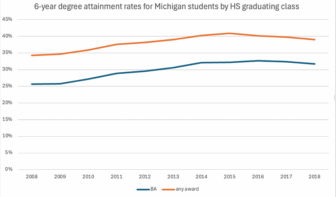
- Proportion of adults with a four year degree: 48th/88.3% of US
- Households with income 1.5 times the poverty rate or less: 36th/100.9% of US
- Households with income 4 times the poverty rate or more: 52nd/82.4% of US
- Per capita income: 52nd/81.2% of US
- Private sector employment earnings per capita: 44th/88.3% of US
- Government employment earnings per capita: 54th/54.6% of US
- Interest, dividends and rent per capita: 45th/71.2% of US
- Transfer payments per capita: 31st/91.2% of US